Traders Reality Home › Traders Reality Forums › Hybrid System Chart Analysis – The Library › W Formations and M Formations › Reply To: W Formations and M Formations
September 19, 2023 at 8:36 pm
#15791
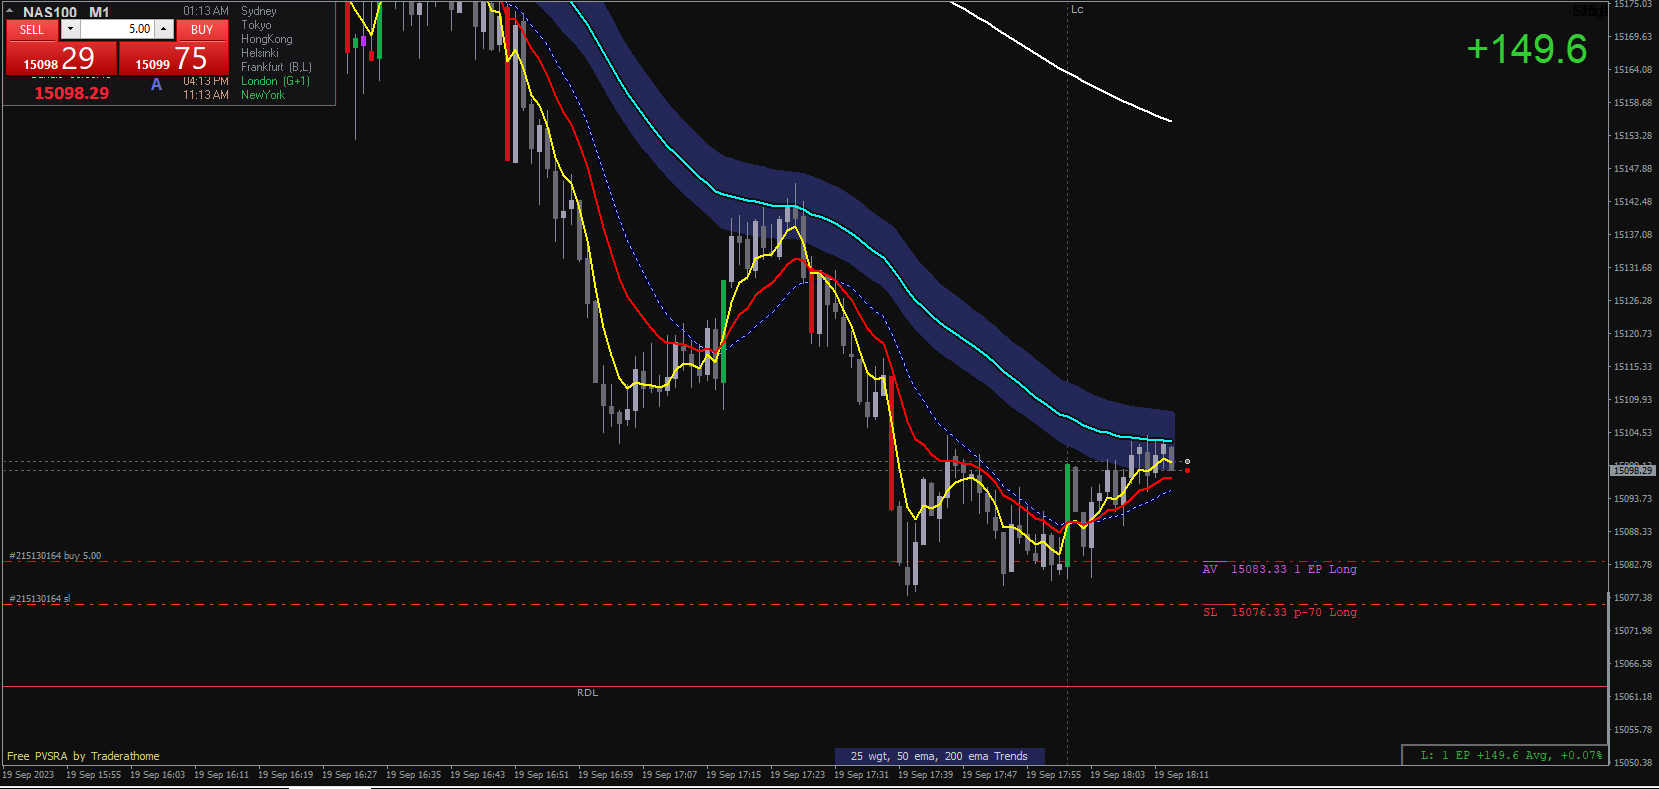
After Nasdaq has been dropping all day during New York and near London Close, a W structure started to occur.
What was visible using hybrid?
- Full-ADR was reached to the downside.
- Red vectors at the lows, on the 15 minutes pulled back quickly leaving a wick (trapped traders shorts).
- Price had deviation away from the 50 EMA on the 5min timeframe and 15min timeframe. Retrace or reversals to be expected.
- M-lines theory where M0 held support, by principle of the Hybrid M0, skip M1, target M2 (this later ended up where price stopped).
Pay to play, no doubt. SL below structure and let it run. Setting TP to 200 EMA, daily VWAP, what ever you like. This trade was made prior to FOMC as the next day has FOMC. So I wouldnt risk sitting in it too long due the a tricky environment.


