This thread focuses on the Patterns W and M formations that appear in the charts. Our goal is to discuss and share charts that show W and M formations developing and completing. This will allow us to create a library of the variations of the W and M formation for future reference.
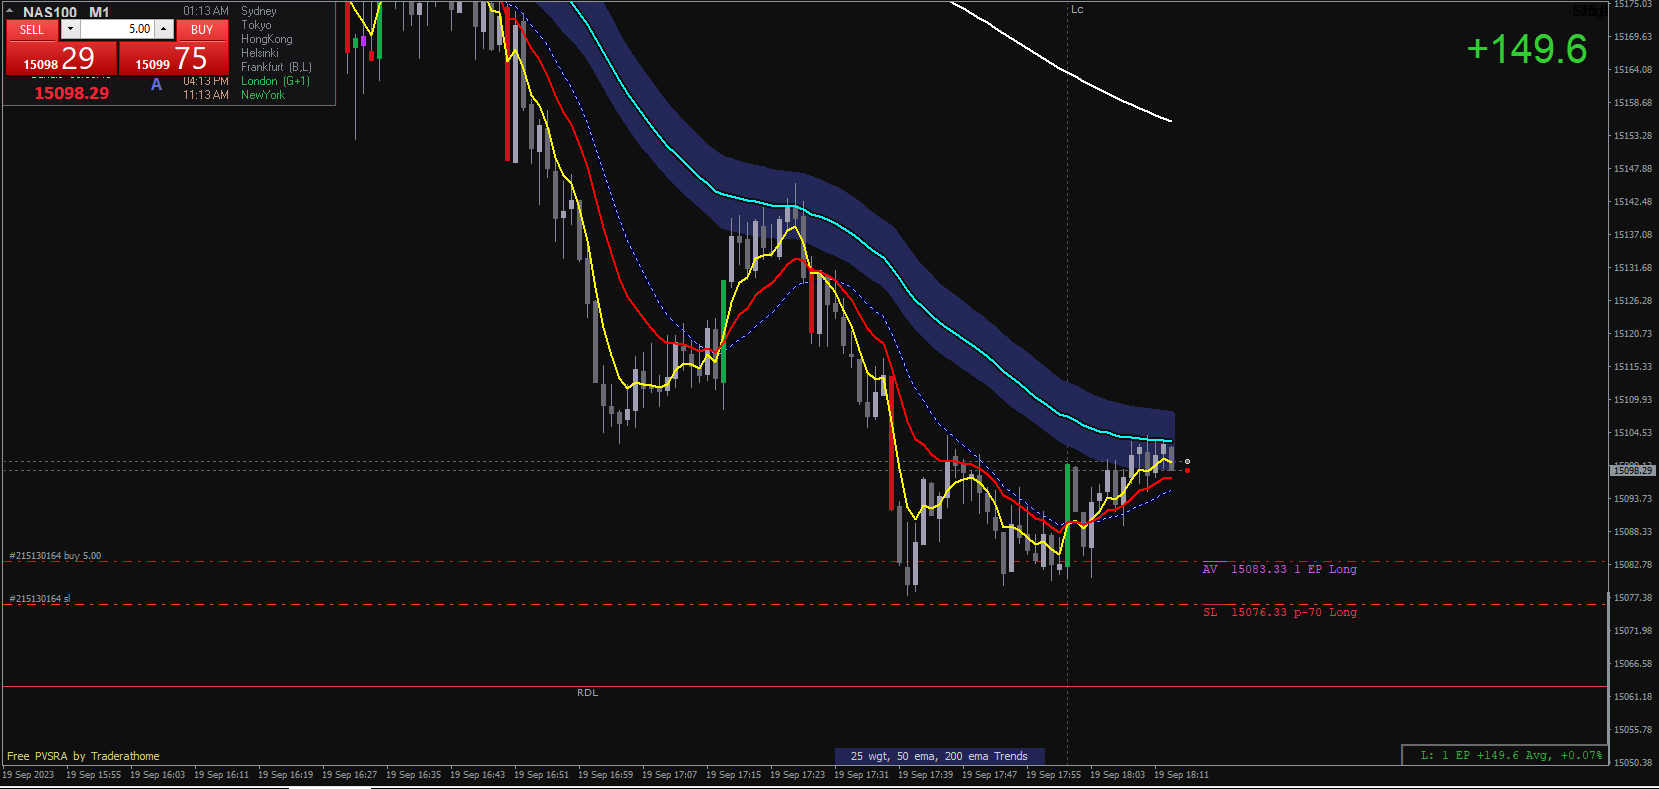
After Nasdaq has been dropping all day during New York and near London Close, a W structure started to occur.
What was visible using hybrid?
Full-ADR was reached to the downside.
Red vectors at the lows, on the 15 minutes pulled back quickly leaving a wick (trapped traders shorts).
Price had deviation away from the 50 EMA on the 5min timeframe and 15min timeframe. Retrace or reversals to be expected.
M-lines theory where M0 held support, by principle of the Hybrid M0, skip M1, target M2 (this later ended up where price stopped).
Pay to play, no doubt. SL below structure and let it run. Setting TP to 200 EMA, daily VWAP, what ever you like. This trade was made prior to FOMC as the next day has FOMC. So I wouldnt risk sitting in it too long due the a tricky environment.
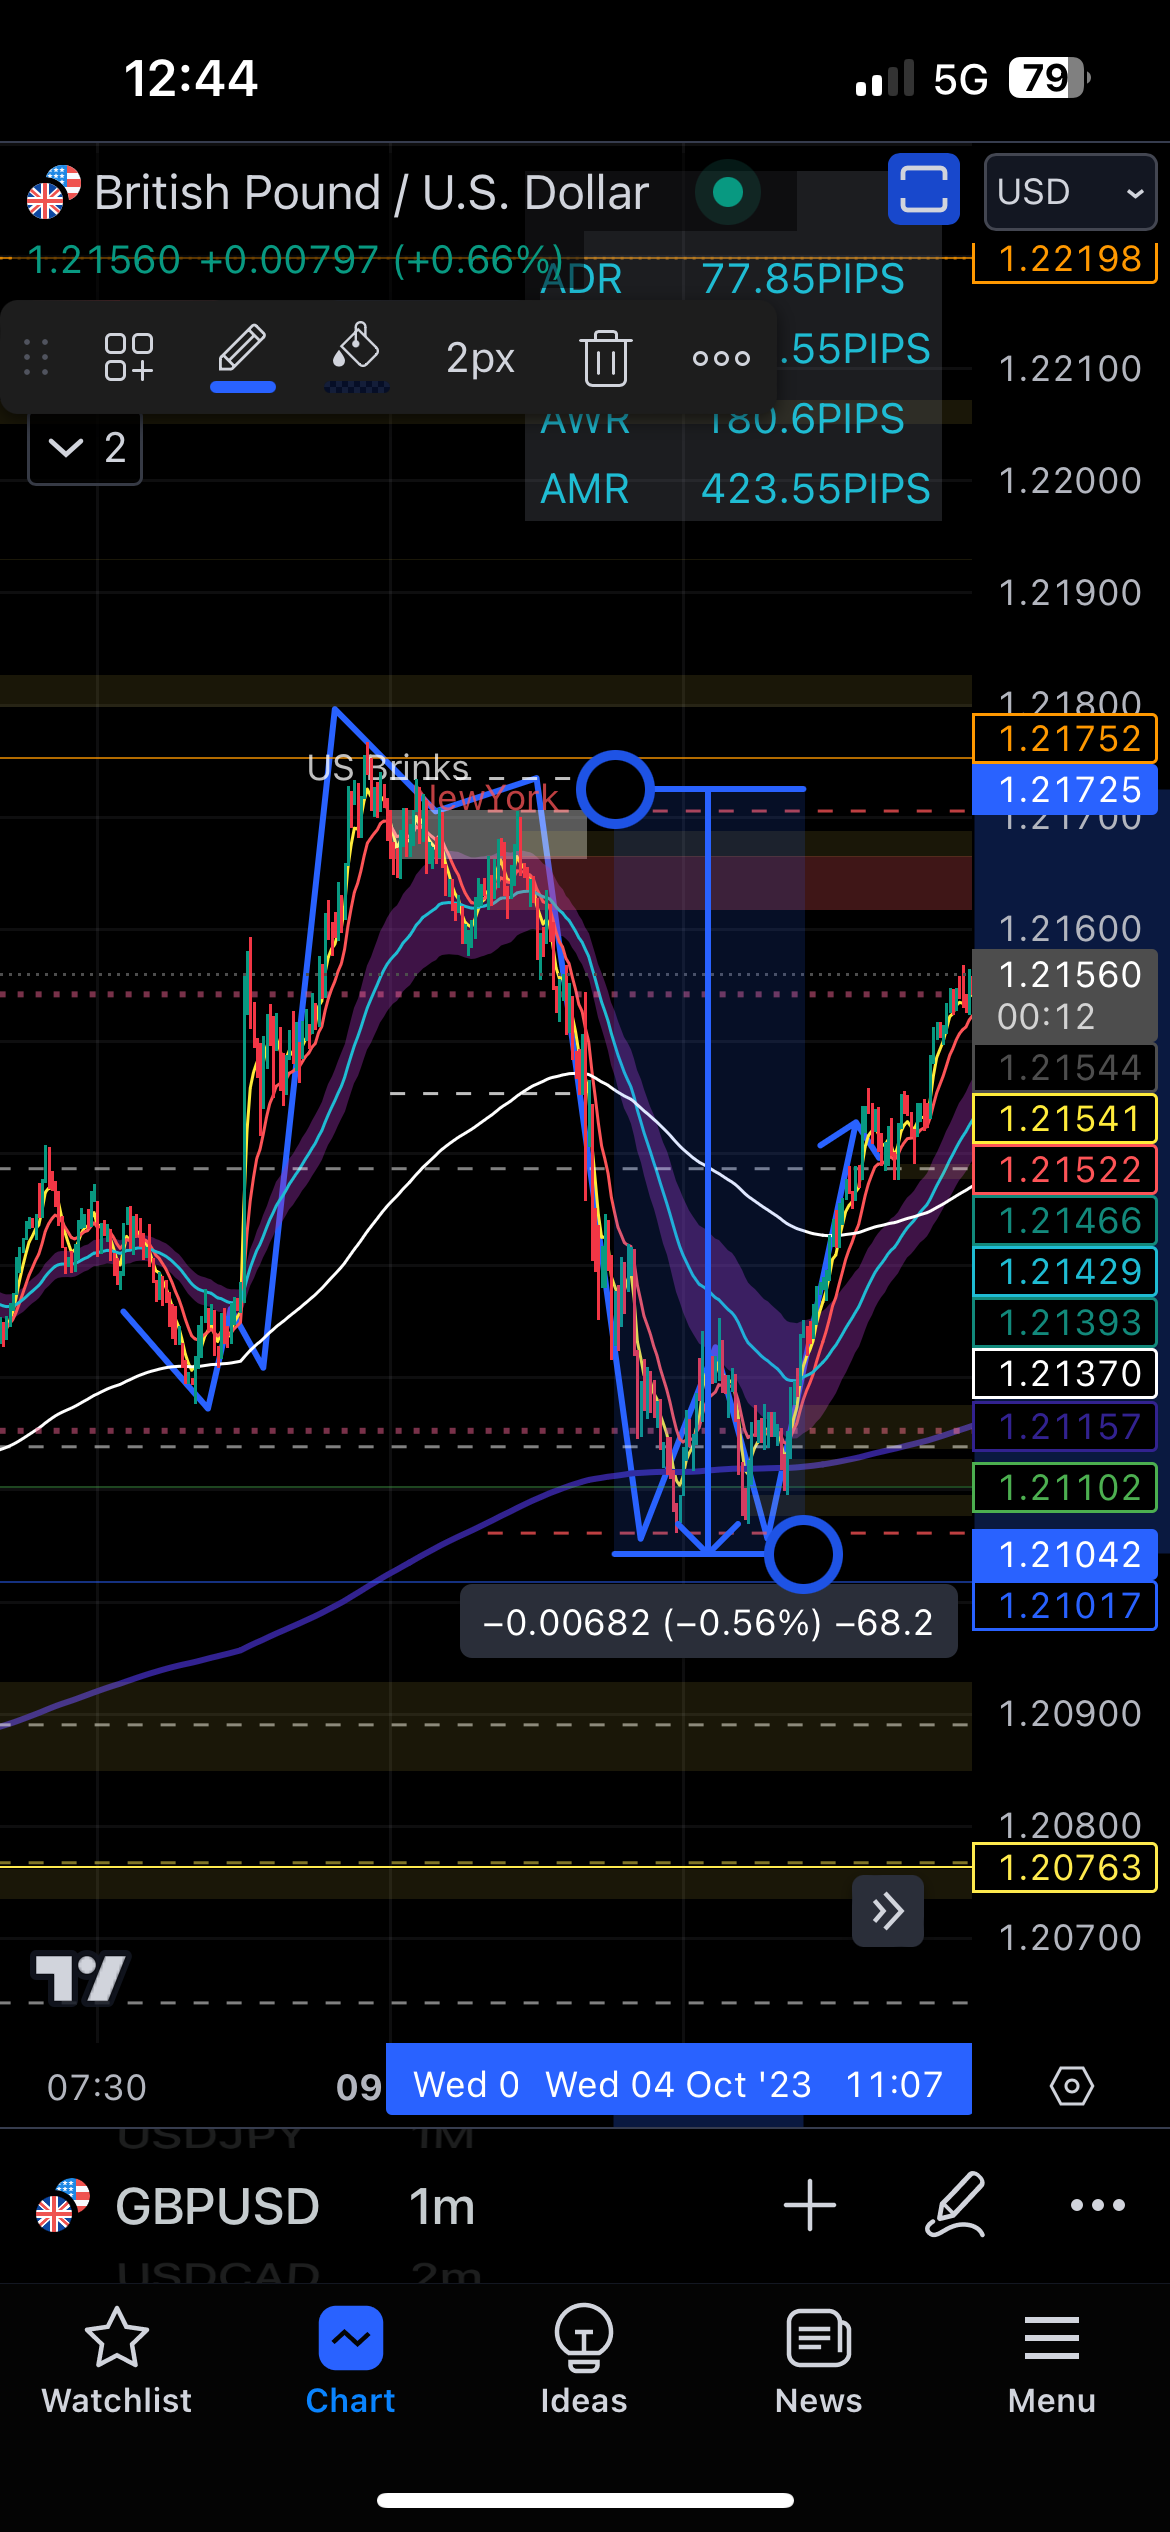
Place Stoploss below the structure, tight. Notice my first attempt gets hunted down. They were not fully ready to reverse. Be a little patient, watch the charts and minimize loss! Then all of a sudden, fast move down. Big red vector. That was my invite towards the trade. SL as we moved lower, was again below the first leg. Keeping my risk to the minimum, I knew we were due for a retrace as we have been dropping past week and even for the whole day. No news announcements to worry about.
 .
.