The images below are examples taken from the bookmap that are showing particular points of interest where orders had come in at specific zones. The idea is to train your eyes to be aware of the behavior of the commitment of traders at particular points so that you as the trader are able to establish the relationship between the interest at one point in the bookmap against another.
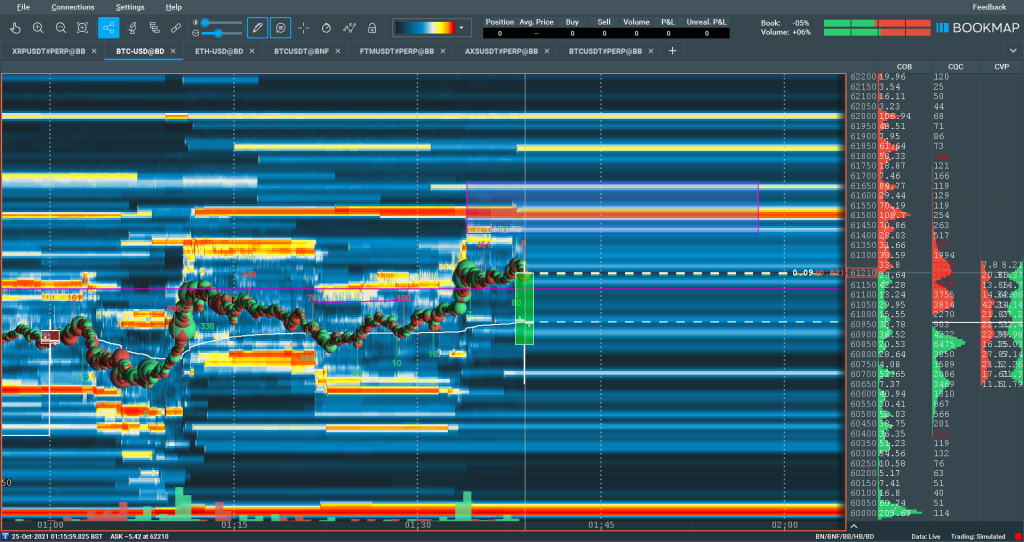
Testing Previous Support
The image above is showing how the bookmap orders were previously filled around the 60600 zone. The principle behind this is to train the eyes to be receptive as to when this sort of play happens, chances are price is going to show support at these zones, which in turn will lead price to return back up.
As you can see,price had come down towards those previous orders, but did not hit that zone. This is something to be aware of. They do not need to hit those previous zones, keep in your mind that if an area is to show support, the orders of limit buys may come in sooner. You can see how price has moved higher.
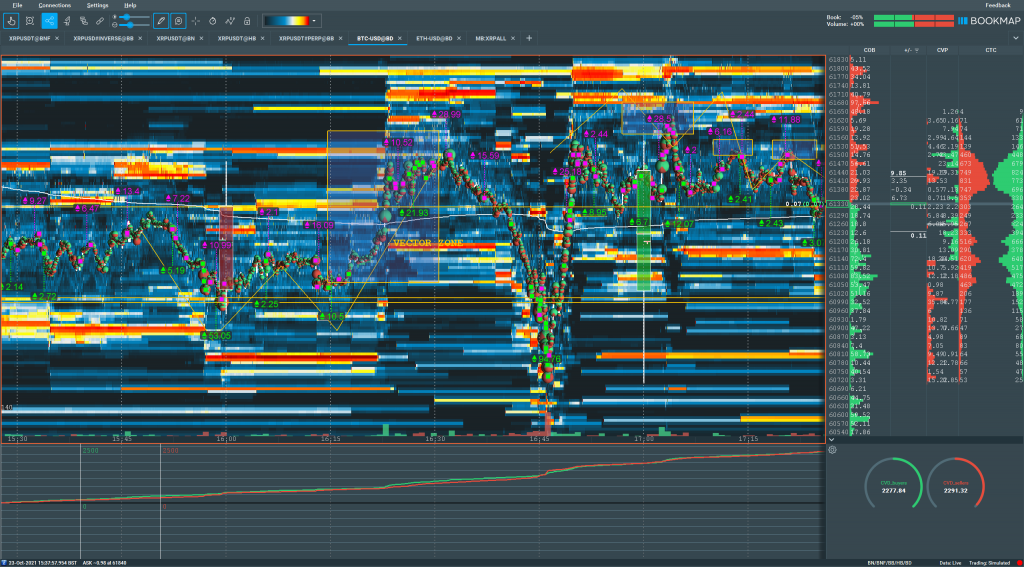
A Whole Move Up And Down
The image above shows you the journey of price in the book map where the start of the W formation shows a vast amount of orders that were resting within the book map. The principle is if price is to return towards this zone, we would see an influx of orders to contain this zone. As you can see, the big V formation presents itself and goes straight back into that zone. Focus on the volume bars below, notice the amount of interest that came into this zone.
Pick points in this chart to help you understand where price turns in the book map that is implying the interest of traders at particular points in the chart.
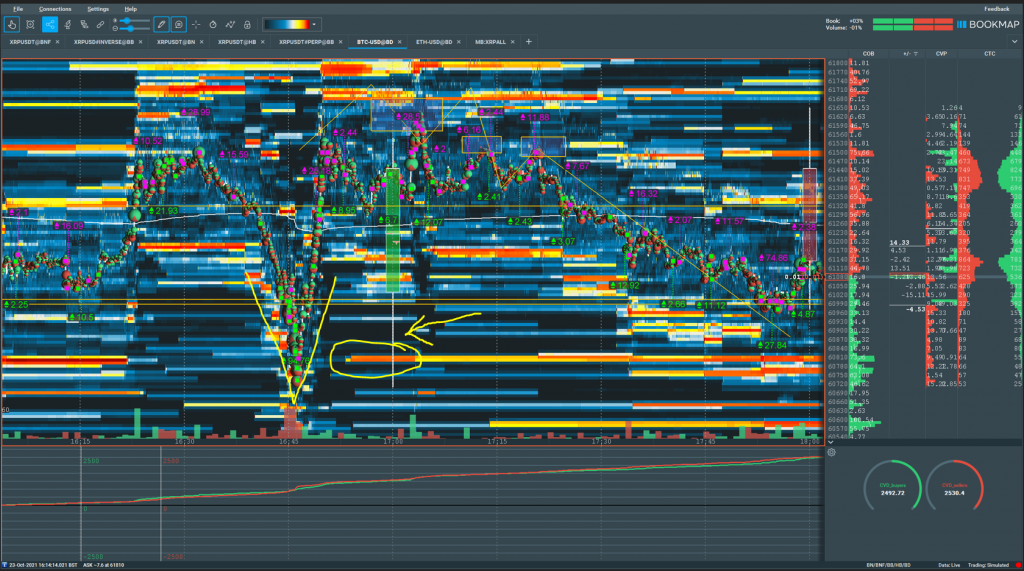
The chart below will give you the result of what happened next.
Pay close attention to this image. If you can recall, I always discuss the importance of Wicks. Notice how from the image above, the big V shape play returns price back towards the highs and we witness the “pinning the highs” in the order book. The candlestick you see is a 1 Hour candle. Now notice how price has now travelled all the way back down to the wick. This is the imbalance that is being restored in price.
HI Tino, thank you for sharing your knowledge. Two request. If it’s possible can you make the images either downloadable or pop-up so we can zoom in? And in parallel to the BookMap can you also include ExoCharts for the examples. Lastly, is there a correlation to the price action that passed ($60.8K) to the left of the “V” shape and future liquidity pools in red? The last image with the V shape that you drew in, am I correct to interpret the smear of red lines bounded by yellow around $60.8K , if they are still present does that mean that the MM did not absorb all of the liquidity? Is that why they return? Thanks in advance.
Hi Tino. I cannot find the same instrument as you BTC-USD@BD
The closest I get is from Binance Futures – BTCUSDT@BNF
Do you have settings or instructions available to mirror your setup?
Thanks for everything legend!
The Multibook doesnt show in the configure addons….I will suss out BM website to try and find problem….sorry bro but i am in a different time zone and sometimes miss important parts of the masterclass etc where you may have explained it. Bookmap is expensive and I want to be on the same page! cheers
Hi Tino.
Do you know where we can download historical bookmap data?
Currently we are looking at Sierra Chart but wondering if you have a different source.
Thanks man!


SoCalKahuna
December 6, 2021 at 8:10 pmHI Tino, thank you for sharing your knowledge. Two request. If it’s possible can you make the images either downloadable or pop-up so we can zoom in? And in parallel to the BookMap can you also include ExoCharts for the examples. Lastly, is there a correlation to the price action that passed ($60.8K) to the left of the “V” shape and future liquidity pools in red? The last image with the V shape that you drew in, am I correct to interpret the smear of red lines bounded by yellow around $60.8K , if they are still present does that mean that the MM did not absorb all of the liquidity? Is that why they return? Thanks in advance.
Tino
December 8, 2021 at 12:11 amHey man, working on this also my friend
REEL
December 8, 2021 at 12:06 amHi Tino. I cannot find the same instrument as you BTC-USD@BD
The closest I get is from Binance Futures – BTCUSDT@BNF
Do you have settings or instructions available to mirror your setup?
Thanks for everything legend!
Tino
December 8, 2021 at 12:10 amHey man, do you have the multi book version added to the plan?
REEL
December 9, 2021 at 1:33 amYes I do
REEL
December 9, 2021 at 4:35 amThe Multibook doesnt show in the configure addons….I will suss out BM website to try and find problem….sorry bro but i am in a different time zone and sometimes miss important parts of the masterclass etc where you may have explained it. Bookmap is expensive and I want to be on the same page! cheers
REEL
December 9, 2021 at 6:52 amMultibook now added…working on instruments…..
REEL
December 9, 2021 at 7:38 amAll done…I think…..Jesus its another language
Thanks for the settings…got them from last nights Masterclass replay
Cheers, Reel
Dave
January 18, 2022 at 2:17 amHi Tino.
Do you know where we can download historical bookmap data?
Currently we are looking at Sierra Chart but wondering if you have a different source.
Thanks man!
DeAi Team